Marketing Budget Optimization: The Strategic Playbook
Asset allocation is not a problem to be taken lightly; the delta between the right and wrong decision can amount to hundreds of millions. Most brands are dealing with biased agency reports and greedy attribution data. Here's the framework I use for scaling brands from $10M to $100M+.
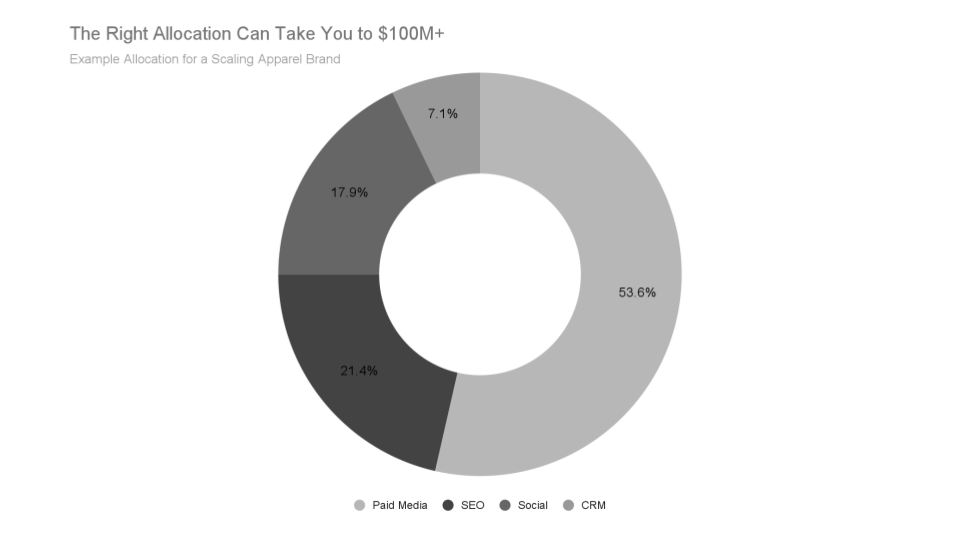
You're staring at your revenue numbers for your DTC business, excited for the future, and wondering: How the hell do I start thinking about marketing budget optimization to grow this thing from 10M/y to 100M/y? You immediately think about looking at your channels. You're doing some paid ads, and it's working, but you're also investing in Social, CRM, SEO, and other channels that are showing potential, too.
And then the next question you ask yourself is: "On which channel(s) should I spend my time, energy, and capital?"
To that question, everyone has a different answer. The ad agency you're working with tells you to increase your budget on ads, and you receive dozens of emails every week about people telling you to be more present on social, to invest more in SEO, and so on. Add all the AI pitches to the mix, and it's easy to feel lost, like you're in a zoo.
I hate that feeling as much as you do. I believe that for any problem, there is a clear solution, and that you can gain this clarity by asking the right questions and listening to the data you've collected so far. Asset allocation is not a problem to be taken lightly; the delta between the right and the wrong decision can amount to hundreds of millions of dollars.
But the good news is that the problem is simple, and fundamentally, there are only two questions to answer for marketing budget optimization:
1. How much should I spend?
2. Where should I spend it?
Before We Start: Channel Interactions
At this point, you might be thinking: Alex, why are you talking about all these other channels, when I only wanted to know how to optimize my budget for paid ads? I know, I know, I'm getting there.
Every time you spend a dollar on paid media, a portion of the revenue generated is attributed to another channel because of the multi-touch nature of the customer journey. This is a consequence of the attribution model you're using, which is not perfect (none are), and the reason why the CPA you see in GA4 is often higher than your true CPA—GA4 simply can't account for every touchpoint.
BUT, ad platforms like Google Ads and Meta Ads are known to have greedy attribution, meaning they will attribute some conversions to them for customers that would have purchased anyway. For that reason, the CPA your marketing agency will give you is generally lower than your true CPA.
All that to say: "What is my true CPA"? is the real question. And the answer to that question is a function of the quality of your data and attribution. If only 75%-80% of your traffic is adequately attributed, or even less, then you can't really answer the question. It's often the case if you're running a Shopify store and using Google Analytics 4 for full-funnel tracking.
Your first crucial task is to ensure you have a solid understanding of your data and its attribution by asking the right people in your company.
Now, onto marketing budget optimization!
How Much Should I Spend?
Your Marketing Efficiency Ratio (MER)
One higher-level metric that won't capture the intricacies of channels but will always give you a true, accurate picture is MER. To calculate MER, simply divide your total revenue by your total marketing spend for a specific month. For most companies I worked with in my career, I see a MER trending like this over the different business stages:
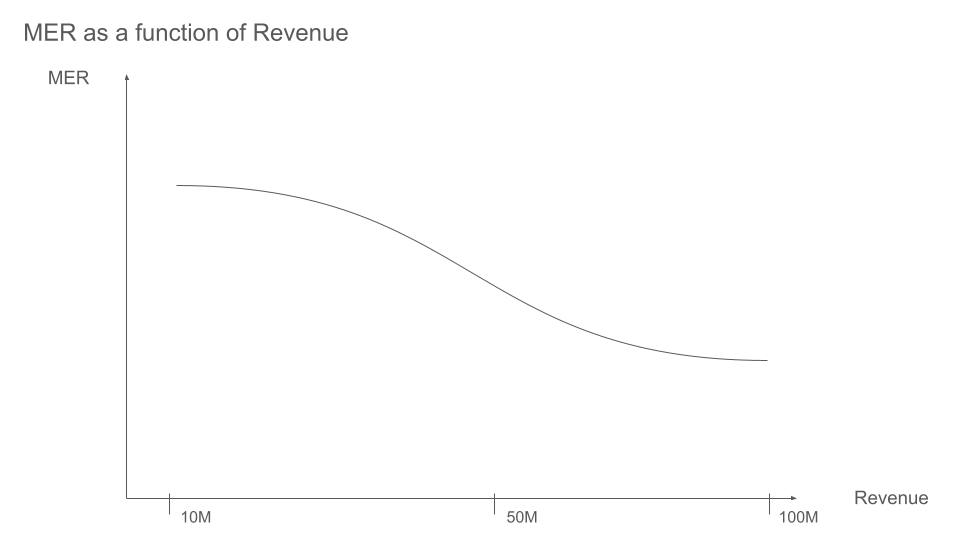
The floor you see on the chart is eventually created because the growing pool of repeat customers (who cost $0 to "acquire" again) eventually offsets the rising cost of acquiring new customers at scale. The leveling off occurs more quickly for some companies as their CRM and other owned channels mature. But for others, it takes longer, where MER would continue to decrease linearly.
But coming back to marketing budget optimization, you need to test different spend scenarios across channels and assess their impact on your MER. For example, if you increase Google Ads spend by 10% for 1 month, what's the effect on your MER? What if you decrease Google Ads by 10% and instead invest in TikTok ads? Then what happens to your MER? The test that yields the highest MER for the same amount of marketing dollars is the winner.
Just keep in mind that in practice, there's a time lag (often 7–30 days) between an ad click and a conversion, especially for higher-priced items. So your tests won't have an immediate impact on MER.
One Dangerous MER Trap
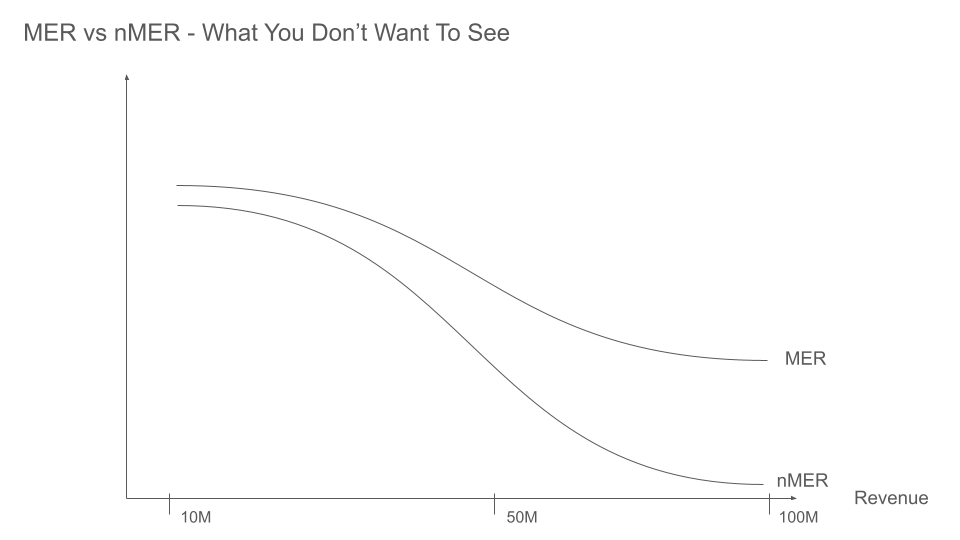
As you know, one metric never tells the whole story. If your customer base is super strong and you have a lot of repeat business, then your MER might show a rosy picture even if you're still spending too much on ads. So another related metric I like to track is New Customer MER (nMER), which is simply New Customer Revenue divided by Total Marketing Spend for a given period.
If you compare your trending MER and trending nMER on a chart, and you see nMER decreasing faster than MER, then it's a sign your retention channels are maturing and hiding a problem on the acquisition side.
What Should My MER be?
There are different approaches, but one that I use often is identifying the breakeven point using gross margin. Let's assume that you made $1,000,000 in revenue last month and $400,000 in contribution margin. If you think about it, it means that if you spent $400,000 on ads, you would have made a profit of $0.
Break-even MER = 1 / Contribution Margin %
Example: 1 / 0.4 = 2.5
With a contribution margin of 40%, your break-even MER is 2.5. This means that for every $1 you spend on marketing, you need to generate at least $2.5 in revenue to avoid losing money.
While these numbers represent your annual baseline, remember that your Break-even MER is a moving target during peak seasons like BFCM. For instance, a 50% sitewide discount slashes your margins, requiring a much higher efficiency to remain profitable, even if the total volume is higher.
In practice, businesses are rarely that aggressive. But I have seen breakeven strategies, especially among VC-backed companies, trying to show growth at all costs. But that's not the only reason.
Customer Lifetime Value (CLTV)
In the previous example, you generated $400,000 in contribution margin in that single month, so you spent that much. The customers who purchase in that month would continue to buy from your store throughout the year, and the year after that. So the value of each customer is more than what they'd spend that specific month.
If you want to get crazy aggressive, you could calculate how much profit $ you expect for the next year for this cohort, and potentially even the next 2 or 3 years. Let's assume that this cohort will bring you an extra $200,000 in contribution margin throughout the year, in addition to the original $400,000, for a total of $600,000. Then you could argue that a MER of 1,000,000 / 600,000 = 1.67 actually makes sense.
But operating at a 1.67 MER requires deep pockets; you are essentially lending money to your future self and waiting for the customer to repay you.
The other way to look at CLTV, even though I won't get into the details here, is your payback period: how long it takes to get $1 back for every $1 you spend on marketing.
A little rule of thumb: A healthy $100M brand typically aims for a 3–6-month payback on its CAC.
The final decision on MER
This is the point where your marketing agency can no longer help you. You and your partners alone must consider your context (bootstrapped, VC-funded, …) and your risk appetite, and define a MER you're comfortable with. If you're bootstrapped, you might want to stay disciplined at 3+, but if you just raised a 100M round, you might feel comfortable with a lower MER.
Translating MER to Marketing Budget
Let's continue with our example above and assume you decided on a MER of 4 or higher. Take your revenue from the last 12 months and divide each month's revenue by your MER (in this case, 4). Take the average of the spend figures for the 12 months, and this will give you a solid idea of your marketing budget. If you're growing quickly, take the average of the last 3 months instead to get your current velocity budget, or use your 12-month average to set a stable annual baseline.
Keep in mind, however, that you might be underspending in your peak months (like November) and overspending in your slow months (like February). While the total annual budget is an average, the monthly allocation should be a percentage of that month's forecasted revenue.
This $250k is your efficient marketing budget. If you can spend that $250k while maintaining your MER, you're winning. If your MER climbs to 5.0, you are being too conservative—spend more. If it drops to 3.0, you've over-scaled. However, before cutting spend, you should evaluate your creative and your Conversion Rate Optimization (CRO).
While optimizing creative brings more qualified clicks, CRO increases the likelihood those clicks turn into bookings. This strategy lowers your CPA and allows you to maintain current spend levels—or even continue scaling—by increasing efficiency at the bottom of the funnel. If these optimizations don't move the needle, then cutting spend remains your final lever.
The Acquisition view: CAC
First off, let me acknowledge something that often confuses people I talk to in DTC businesses. CPA is frequently used interchangeably with CAC, but CPA usually refers to a specific platform's cost per conversion. In contrast, CAC is the "Blended" cost across all channels, including the untrackable ones.
To calculate your CAC, sum up all your marketing and sales costs for a specific month, and divide them by the total customers you acquired during that month. If your sales costs are fixed and negligible compared to your marketing spend, you may exclude them for simplicity.
CAC = Total Marketing Spend / New Customers Acquired
Example: $200,000 / 3,000 = $67
So let's reuse the example above: You made $1,000,000 in revenue last month, acquired 3,000 new customers, and spent 200,000 on marketing. Your CAC is therefore $67. In other words, every new customer you acquire costs you $67.
So, how much should you spend?
The breakeven scenario: If you spend $67 to acquire a new customer, you need your Contribution Margin to be at least $67 to break even on the first order; the following orders your customer places are incremental profit.
How to use CAC alongside MER
To achieve sustainable growth, your CAC / Contribution Margin or CAC / CLTV ratio needs to be kept in check. These ratios, along with nMER, paint a picture of how well you acquire customers efficiently. MER tells you if your business is profitable today. From that perspective, CAC ratios and nMER are leading indicators for tomorrow's MER.
Answering the question: How much should I spend?
To be clear: this question cannot be answered by a marketing agency or any external resources. The leadership team should answer this question, and fundamentally, it has nothing to do with existing channel performance. It's a question that should purely be answered in relation to the business model and unit economics.
For example, if the unit economics support a $60 CAC, but current channels are delivering a $40 true CPA, in a first-order breakeven scenario, the answer isn't "keep spending the same." The answer is "aggressively increase spend until the marginal CPA reaches $60." You are setting the budget based on capacity, not just current performance.
Where should I spend?

Coming back to channel interactions and tracking accuracy that we discussed above, in an ideal world, you would have a true CPA for each channel. If we had a "True CPA" for every channel, marketing would be a simple math problem: put the next dollar into the channel with the lowest CPA until it saturates, then move to the next.
But because we live in a world of "Greedy Attribution" and signal loss, we have to bridge the gap.
- The Engineer's Solution: Implement server-side tracking and first-party data loops to make your "Low Level" (CPA) view as accurate as possible.
- The Statistician's Solution: Use Marketing Mix Modeling (MMM) to look at the "High Level" (MER) and see which channel spend actually moves the needle on total revenue.
But what is, in my view, the gold standard solution: use the Engineer's solution to optimize daily, and the Statistician's solution to optimize quarterly.
The Engineer's Solution
There are always ways to improve tracking and make it more accurate. Often, especially when using platforms like Shopify, it makes a lot of sense to use server-side tracking and get back 15%-20% or even more of the traffic that was previously unattributed due to ad blockers and ITP.
This solution will provide you with a more accurate distribution of traffic and conversions in your analytics tool, such as Google Analytics 4. Having more accurate data in GA4 will allow you to compare the CPAs your marketing agency is providing for different channels, such as Google Ads.
But keep in mind that this solution remains an approximation, since it's impossible to have 100% attribution, and the attribution model you choose (first touch, last touch, data-driven, etc) changes the picture quite significantly.
I like to use this solution for daily, weekly, or monthly recalibration of spend across marketing channels. And after implementing this solution and a couple of months of recalibration, you should see the feedback kicking in your MER: You should see a definite increase in MER because a more accurate picture of CPA allows more efficient spending, or more revenue for the same marketing budget.
The Statistician's Solution
But even with near-perfect tracking, something important is still not accounted for: channel interaction and offline marketing. If you have billboards up, you won't see that in GA4. Furthermore, it's possible that if you spend on both Google Ads and Meta Ads, and you suddenly stop spending on the latter, then efficiency on the former would collapse. That's because, often, TOFU (Top of the funnel) channels work hand-in-hand with BOFU (Bottom of the funnel) channels.
To quantify the interaction between channels and understand the actual impact of a dollar spent in each one of them, you need the statistician's solution: Marketing Mix Modeling. It's a fancy term, but simply put, it means looking at your weekly or monthly spend per channel over time, combined with other factors relevant to your business, and building a model that predicts the revenue you've observed each month.
If you can build such a model with decent accuracy, you can start optimizing by asking the model what would happen if you increased or decreased spending in some channels. Furthermore, you can see the actual impact in dollars of each channel, and that's also true for your offline channels. Learn more about using MMM to identify true incrementality →
What I like most about MMM is deriving CPA for each channel every quarter, and triangulating true CPA by comparing it with the CPA we see in GA4 and ad platforms. They are all different, but they lead to very productive conversations and to the allocation of the marketing budget.
Overall, MMM provides the strategic direction (where to put the next $1M), while the Engineer's tracking provides the tactical execution (where to put the next $1,000 today).
One last thing on marketing budget optimization
That was a lot! But we answered the two questions needed for marketing budget optimization: How much to spend, and where. But more importantly, I wanted to share a decomposed view of the problem so it's crystal clear, and remove all confusion.
I also wanted to highlight how important it is to answer some questions yourself, with your partners and leadership team, rather than relying solely on the opinions of 3rd parties such as marketing agencies. Even if they're doing their best, they're often working with biased data (the only data they have), and don't have an inside view of your business.