Using Marketing Mix Modeling (MMM) to Identify True Incrementality And Avoid Ad Spend Waste
Stop letting Greedy Attribution dictate your capital allocation. Ad platforms are built to claim credit for every conversion, even those that would have happened without them. You’re likely wasting 20-30% of your spend on customers who would have found you anyway.

You understand very well that Meta/Google ROAS reporting is biased; Last-Click Attribution is not the full story, and Data-Driven attribution is a black box. Plus, you're tired of seeing your CAC rising, making it hard to scale your DTC business. That's where Marketing Mix Modeling (MMM) can help, moving from guessing what's working to a data-driven budget allocation by identifying true incrementality.
Why Marketing Mix Modeling?
True Incrementality
Paid Channels Interactions
So what does incrementality mean anyway? When you spend on multiple channels, it becomes difficult to understand your true marginal CAC for each channel because they are not independent. An increase in Meta spend will likely benefit Google Ads, making it look better than it should, or vice versa.
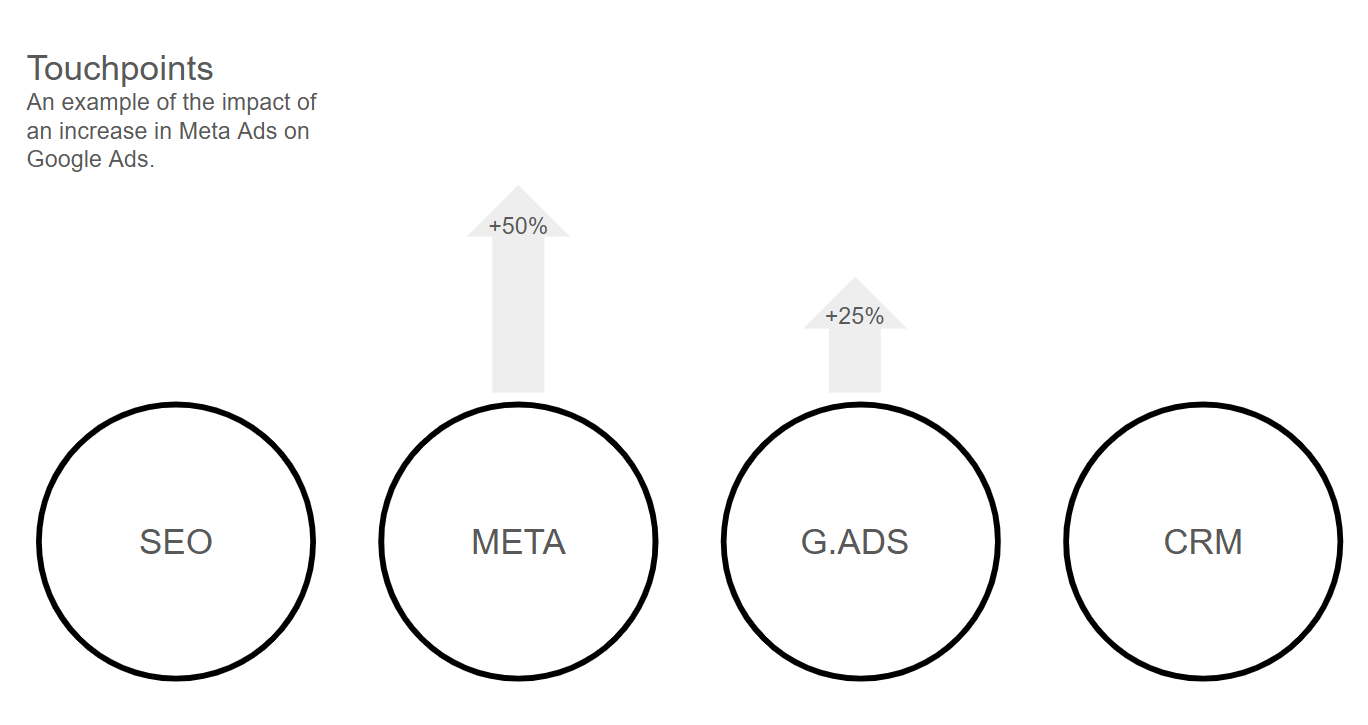
In other words, by looking at performance metrics of Ad platforms in silo, you might make the erroneous decision of increasing your budget in places where you shouldn't, and reducing it on platforms where you should spend more. This lack of visibility has a very real cost, leading to ad spend waste and an inflated CAC. MMM will help you avoid this by identifying the saturation points at which spending an extra dollar on a channel costs more than the customer is worth.
Organic and Brand Equity Attribution
But wait, there is more. You know all those efforts you've put into SEO and the branding and PR you've done, the ones that you can't measure ROI easily? Once again, MMM helps us understand true incrementality. It will allow you to separate the impact of organic demand and brand equity from sales driven by ads.
Beyond your marketing efforts, the model must also account for external factors such as price elasticity and macroeconomic indicators (e.g., inflation or consumer confidence). If there's a dip in sales, we want to avoid incorrectly blaming your ads when the cause is a price hike or a broader market downturn.
Once you understand that channels aren't silos, you have to account for the fact that they don't work instantly, either.
Ad Stock Effect
When you pay for an ad, the effect is not immediate. It can take multiple days or weeks for conversions to occur. One of the businesses I worked for with a larger AOV saw a median conversion carryover effect of 21 days. In general, low-AOV/impulse-buy brands typically see shorter carryover effects (3-7 days), whereas premium brands need to model for longer windows. In any case, MMM will take into account lag effects, meaning it can help you spend more efficiently throughout the year, but more importantly, during big sales, by making sure you spend enough in advance.
Predictable Scaling
True incrementality is not the only benefit of MMM. A model that does a good job of representing reality can also serve as a forecasting tool, enabling you to predict stable revenue from your ad spend accurately and, in turn, stabilise CAC.
That being said, keep in mind that MMM is a probabilistic tool, not a deterministic one. It provides a range of outcomes. If a competitor launches a massive sale or your website goes down, the forecast breaks. Still, MMM reduces uncertainty and provides a framework for predictable scaling.
Preparing For Marketing Mix Modeling
You've made your mind; you want a Marketing Mix Model! You made the right decision, but now starts the process of getting your data ready.
Clean Dataset
The first thing that you need to get ready is your data. The dataset you need to do MMM looks like the table below, but keep in mind that it often requires many more columns.
Tip: If you have it, provide Geo-level data (Sales and Spend by City or State). This dramatically increases the number of data points for the model, making it much more accurate even if your national spend is relatively flat.
At a minimum, you need a clean CSV file with daily numbers and your revenue numbers. This can be tedious to put together if you don't have a data employee. But don't worry if your data isn't 100% perfect. A good consultant or SaaS platform can work with some missing pieces. The most important step is gathering what you do have to identify the gaps. Check out the MMM Data Readiness Checklist at the end of this article to see if your dataset is ready.
BBO (Buy, Build, Outsource)
Like most decisions, you need to choose between buying a solution (often in SaaS form), building it in-house, or outsourcing it.
Buy
There are many SaaS MMM platforms such as Recast, Measured, Mutinex, and Triple Whale. The pros are that they are relatively affordable, and you get insights quickly. But you do need to do some of the work yourself, and it requires an understanding of marketing to interpret results correctly. If not, even the best numbers can lead to the wrong decisions.
Build
You could build a solution for free using Python/R libraries like Robyn (by Meta) or LightweightMMM (by Google). If you have in-house data engineers and data scientists, it could be a viable solution. The benefit is that you get total control, all your data stays in-house, and you can tailor it to your exact needs. But obviously, if you don't already have the resources in-house and need to hire, then this solution becomes extremely expensive.
Outsource
The last option is the white-glove service. You hire a specialised consultant who will refresh the model throughout the month and interpret the results to help you build a solid media plan. This avoids the black box of relying solely on a marketing agency, because you have a counter-balance person working for your own interest. The cons can be the cost, depending on the consultant.
Beyond just running the numbers, a specialised consultant can run experiments to calibrate the model. Sometimes there isn't enough variance in spend data to model accurately. To significantly improve the model's validity and accuracy, they can anchor the model's coefficients. This will significantly improve the model's validity and accuracy.
Working With Your Marketing Mix Model
Once you have your model in hand, you won't receive a single number; you'll receive a comprehensive package of insights. Here are some of the things you can expect to get.
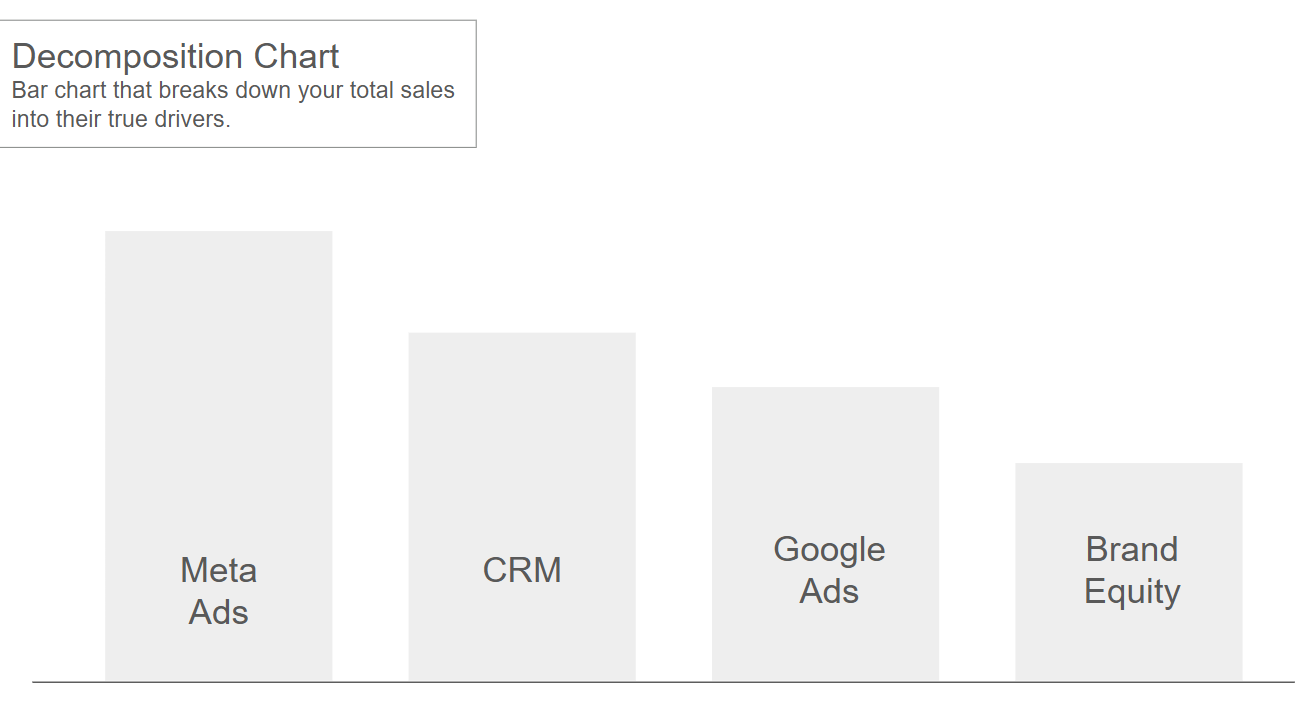
The Decomposition Chart
The decomposition chart separates your Base Sales (what you would have sold with $0 ad spend due to brand equity and SEO) from the Incremental Lift generated by each specific channel (Meta, Google, TV, etc.). It will allow you to look at a specific month and understand the true driver of low or high sales, so you can do less of what's not working and more of what's working.
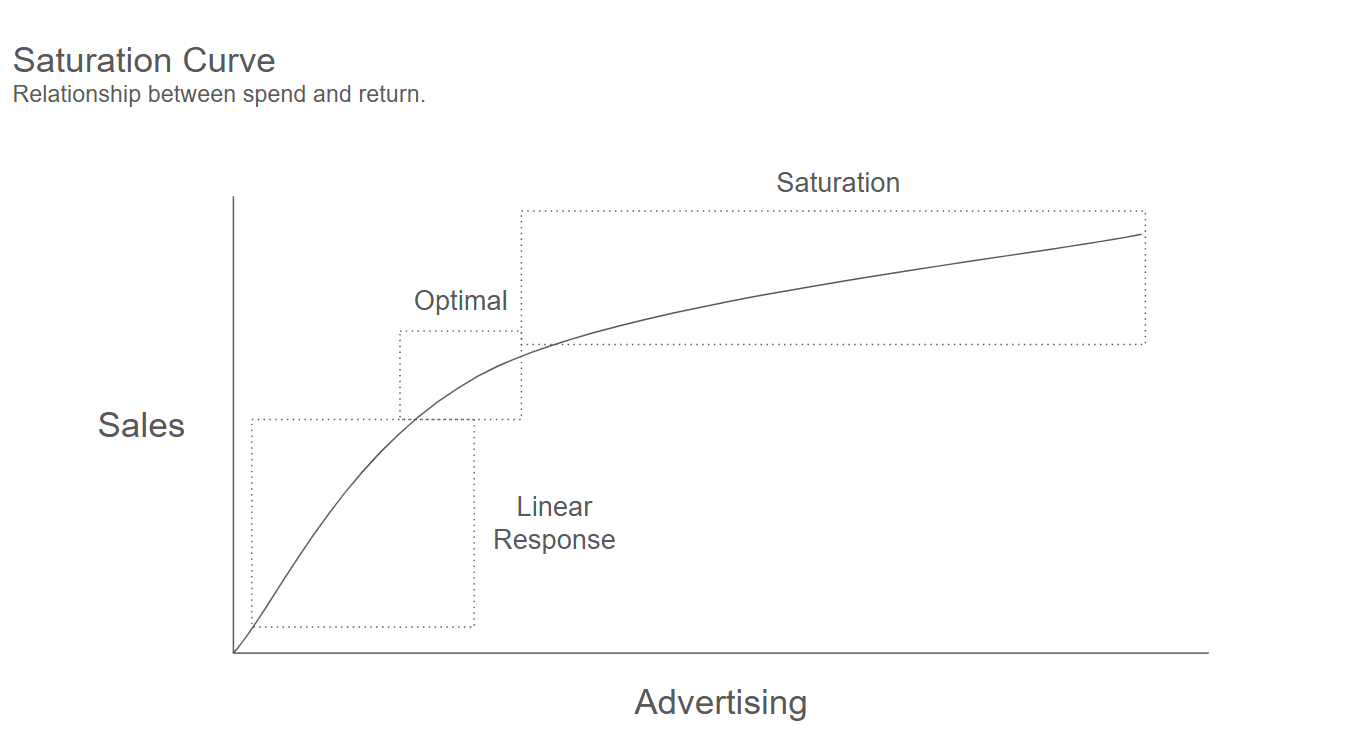
Saturation Curves
For each channel, you get a Saturation Curve that shows the optimal spend level. For non-paid channels, instead of spend, you can measure effort, like the number of road shows. And that's the main benefit: Saturation curves tell you exactly where to stop doing an activity or spending. If you are on the flat part of the curve, every extra dollar is being wasted. It helps you find the sweet spot for every platform.
Marginal ROAS vs Average ROAS
You will receive a table comparing these two metrics. This is often what I see as the "Aha!" moment. For example, you might realise that while Google Search has a high average return, its marginal return is low—meaning you should actually shift those dollars elsewhere.
Example of Performance Comparison Table: Average vs. Marginal
The Optimised Budget Allocation
This is a "what-if" tool that lets you use a slider to set the total marketing budget you want to invest, and it returns the exact channel split you should allocate to maximise revenue. It removes the guesswork from budget planning. You can simulate scenarios like this one: "What happens to revenue if I cut TikTok by 50% and move it to YouTube?" For a comprehensive framework on determining your total marketing budget using MER and CAC, check out my complete marketing budget optimization guide →
Ad Stock & Carryover Insights
You will get a decay metric for your channels. For example, your model might show that 50% of a YouTube ad's impact occurs in the first 7 days, with the rest lasting for 3 weeks. This allows you to plan the priming phase for major sales events like Black Friday, knowing exactly when you need to start spending to hit peak impact on the sale day.
Finally, the impact
To wrap this up, let's get real about why you're actually here.
You didn't read this guide because you have a passion for econometrics or Python libraries. You read it because you're tired of the attribution tax, where every channel claims 100% of the credit while your CAC and revenue say otherwise.
Marketing Mix Modeling enables you to achieve predictable, efficient growth.
If you walk away with nothing else, remember this:
- Brand Equity is your foundation: If you don't know what you'd sell with $0 in spend, you can't possibly know what your ads are actually doing.
- Marginal CAC is your guide: Stop chasing high average ROAS on saturated channels. Find the "underspent" opportunities that the black boxes are hiding from you.
- The Model needs to be recalibrated: A model is only as good as the experiments you run to prove it right.
The DTC brands that will dominate the next decade aren't the ones with the best hacks or the most aggressive bidding strategies. They are the ones who own their data, understand their incrementality, and allocate spend efficiently.